Partner Article
The Complete Guide to Mergers and Acquisitions Fees, Year 2017 Report
Several companies in North America formulated a report regarding the guide fees for small and medium sized businesses that have performed mergers and acquisitions for the past year. The report originated from a research that these North American companies initiated, and the method that they used is through surveying. They conducted the study involving several businesses, and asked them questions related to merging and acquisitions. The survey was given to several businesses between the month of May to August, and the total number of respondents is 678. The report was soon published as the 2017 M&A Fee Guide.
The respondents were classified based on their occupation, in order to make a clear and transparent report. Of all the 678 respondents that were surveyed, 70% or 471 individuals claimed that they are working as an investment banker, or a merge and acquisitions advisor. After identifying who are working for the merge and acquisitions industry, the study then started excluding those who are not working as an investment banker, or as a merge and acquisitions advisor. The number of respondents was also recorded.
The study presented that 42% of those who were surveyed were from the United States, while 32% came from Western Europe, including Scandinavia. This represents almost three-fourths of the entire number of respondents. Moving on, 6% of the respondents came from Canada, another 6% came from Latin America, and another 6% came from Asia. 3% of the respondents came from Eastern Europe, including Russia, 2% came from Australia, another 2% came from the Middle East, and 1% came from Africa.
The study also classified the respondents based on the industry that they are working for. According to the responses of the respondents, 23% are generalist, 14% came from the manufacturing industry, another 14% came from the media and telecommunications industry, and another 14% came from the technological industry. 8% of the respondents came from consumer and retail, and another 8% came from the healthcare industry. 7% of the respondents came from the energy and power sector, 6% came from the financial services industry, 4% came from other industries, and 2% came from the real estate industry. After the backgrounds of the respondents were identified, the questions were given and the results were as follows. The first question was about the number of deals that each company makes annually. 2% responded that they only make less than one deal annually; 42% responded that they make between one to five deals annually; 28% responded that they make between six to ten deals annually; 11% responded that they make 11 to 15 deals annually, and 17% responded that they make more than 16 deals annually.
The study also presented the minimum transaction value that each deal produces. 37% of the respondents stated that they make less than $5 million per transaction; 24% of the respondents stated that they make at least $ 5 million per transaction; 17% of the respondents stated that they make at least $10 million per transaction; 11% of the respondents stated that they make at least $20 million per transaction; 7% of the respondents stated that they make at least $50 million per transaction; and finally, only 4% of the respondents stated that they make more than $100 million per transaction.
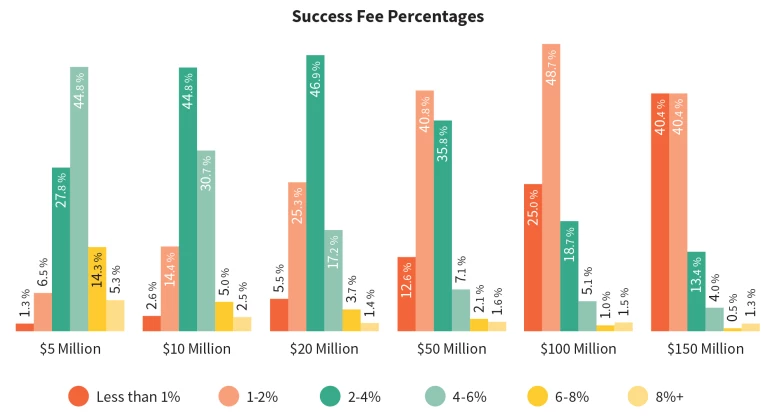
For every successful transaction in merge and acquisitions, a success fee is being imposed, and it was summarized to become a guide. The respondents were asked about the method of how they calculate their success fees. 45% of the respondents stated that they are using a scale percentage as the basis on how much the success fee will be; 28% of the respondents stated that they are using a simple percentage as the basis on how much the success fee will be; 18% of the respondents stated that they are using the Lehman formula as the basis on how much the success fee will be; and finally, only 9% of the respondents stated that they are using other methods as the basis on how much the success fee will be. The respondents were also asked how much they think they will earn from each successful transaction. 44.8% of the respondents stated that they will be earning 4% to 6% from success fees in a transaction worth $5 million; 27.8% of the respondents stated that they will be earning 2% to 4% from success fees in a transaction worth $5 million; 14.3% of the respondents stated that they will be earning 6% to 8% from success fees in a transaction worth $5 million; finally, 5.3% of the respondents stated that they will be earning over 8% from success fees in a transaction worth $5 million.
As the value of the transaction rises, the percentage also changes. If the transaction is worth $10 million, 44.8% of the respondents stated that they will earn 2% to 4% from success fees, while 30.7% of the respondents stated that they will earn 4% to 6% from success fees. If the transaction is worth $20 million, 46.9% of the respondents stated that they will earn 2% to 4% from success fees, while 25.3% of the respondents stated that they will earn 1% to 2% from success fees. If the transaction is worth $50 million, 40.8% of the respondents stated that they will earn 1% to 2% from success fees, while 35.8% of the respondents stated that they will earn 2% to 4% from success fees.
If the transaction is worth $100 million, 48.7% of the respondents stated that they will earn 1% to 2% from success fees, while 25% of the respondents stated that they will earn less than 1% from success fees. The largest transaction is worth $150 million, and 40.4% of the respondents stated that they will earn 1-2% from success fees, while an equal percentage of 40.4% of the respondents stated that they will earn less than 1% from success fees. The 2017 M&A Fee Guide will be uploaded and will be available for everyone.
Download full PDF Report here: Firmex.com/resources/ma-fee-guide-2017
This was posted in Bdaily's Members' News section by gabted .
Our Partners


 Why local government is key to devolution success
 Your reputation is worth more than that invoice
 There is no perfect time when selling a business
 What next when social media career help goes?
 The psychological contract that nobody signs
 Time for strategy built on the foundational economy
 Why being ‘work-ready’ matters more than ever
 The North's future doesn't end at Manchester
 Exit or legacy? Why every owner needs a plan
 Who speaks up for SMEs when giants get bigger?
 The true value of HR in an AI-driven working world
 What new business rates guidance means for pubs