Partner Article
Estimating the economic risks of Scottish Independence
By Mark Somers, Technical Director at 4most Europe and Alexander Denev Founder of GraphRisk
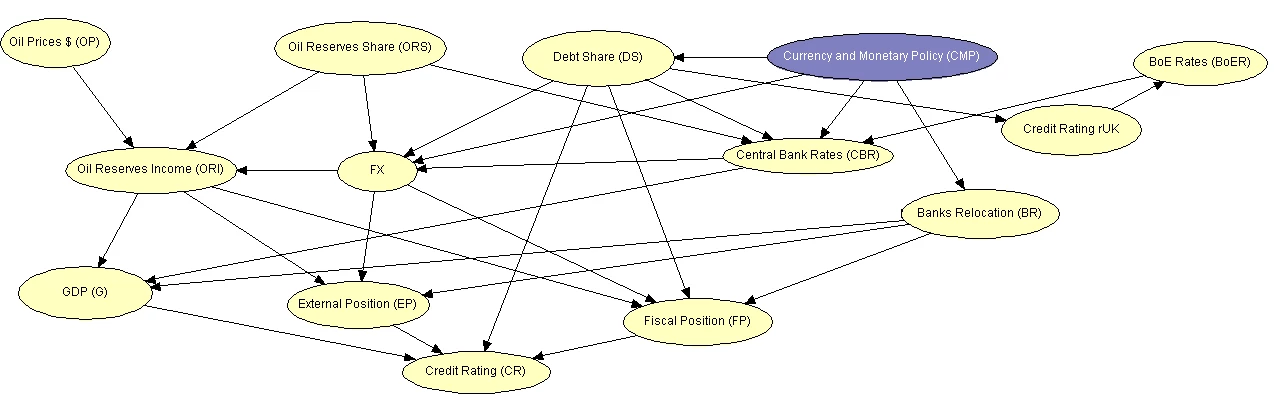
Scottish Independence (if it happens), will be a once in a lifetime event but the need to estimate the impact of unlikely events like this (i.e. Euro breakup, British EU exit, Ukraine crisis, war in the Middle East and so on) is a depressingly routine problem. It is the type of problem that until recently was the unrivalled domain of “expert” analysts whose prognostications depend as much on the political point they or their backers are trying to make, as it does on having any specific evidence. Following the financial crash of 2008 however, there has been much research and thinking on how to model systematically, the outcome of improbable events. Increasingly there is a consensus growing as to how these problems can be tackled. The key is to build a visual language that can describe a scenario, which anyone can assess as to its appropriateness, but that can also be turned into a numerical, estimate of likelihood and impact. Typically evaluations of a scenario start with an economic narrative, these are not strictly quantitative statements but they encompass the key causal mechanisms that are at play. These narratives can then be turned into what mathematicians call a “probabilistic graphical model” or PGM - a set of nodes and arrows (see diagram).
Each node represents a measurable quantity and each arrow represents the direction of cause and effect. These diagrams are easily interpreted but of more mathematical interest are their properties for transmitting probabilistic information. Specifically, if the state of a node is known, (say Scotland becomes independent and takes no share of the Debt in the example above), then the probabilities of any nodes with connections with it (Foreign Exchange, Interest Rates, and Credit Rating for UK) will be updated and this updated information can then be propagated across the rest of the network. In his influential book “Causality” published by Professor Judea Pearl in 2000, he highlighted amongst other things, that a system under sudden change is likely to cause a breakdown of only a handful of key causal relationship. The dependencies of all the other causal relationships however are likely to stay the same. Now, to work out what will happen in the event of an unlikely event we just need to patch up the handful of broken links; we don’t need to try and rebuild the whole model from scratch. It also means all of our empirical experience of how the world works is not discarded - only the parts directly connected to the postulated shock need to be re-evaluated.
This approach is proving very powerful with a handful of large financial services companies exploiting these mathematical tools to evaluate the impact of Scottish Independence using exactly these approaches. The methodology keeps boards, executives and regulators in the loop as to what lies behind the model (no black boxes). A further benefit is that having built one scenario it is relatively straightforward to reuse the majority of the network to evaluate a wide range of other scenarios - this is the key to good risk management, anyone can prepare for the one bad event they are expecting. It is the marginal scenario that happens to materialise, that causes the problems. Evaluating more scenarios should mean fewer nasty surprises.
So back to the case in point – what are the lessons we can learn from this approach in the event that the Scots do vote Yes today?
The monetary arrangements, oil reserve and debt shares are the first things that have to be solved by Scotland/UK but these problems are not independent of each other. If Scotland is not given the pound, it has the incentive to accept a lower portion of debt, or even repudiate it. If it finishes with its own currency – the Scottish pound (SCP) – it has to be either pegged or floating. A pegged currency needs enough foreign reserves to be maintained but this will not be the case unless Scotland reserves exceed roughly two months of exports. A solution would be to raise the central bank rates to attract capital. If the SCP is floating, on the other hand, its value will depend on many parameters such as the amount of debt, oil reserves and the newly formed Scottish central bank rates.
For the remainder of the UK, if Scotland repudiates its debt, then it would likely result in a one or two notch credit down grade. This would weaken the currency and could cause BoE to raise rates to keep the inflationary targets. All these ramifications are difficult to follow in a narrative (and we have just described very few of them) but they are easily represented in a graphical form, and a graph encodes not one, but many narratives, each weighted by its probability of occurrence. All the connections between events (causes and effects) are clearly visible and can be inspected even by non-specialist. Mathematical theory helps to achieve probabilistic and logical consistency. Needless to say that a 100-page narrative or a black-box econometric model will obscure all the subtleties and ramifications behind such a scenario.
Finally, markets are already pricing some of these events (e.g. the GBP/USD devaluation in the past weeks). Graphical models can also be calibrated on these market signals to come up with probability estimates for some of the events represented in the graph.
This was posted in Bdaily's Members' News section by 4most Europe .
Enjoy the read? Get Bdaily delivered.
Sign up to receive our popular morning National email for free.
Our Partners


 Why local government is key to devolution success
 Your reputation is worth more than that invoice
 There is no perfect time when selling a business
 What next when social media career help goes?
 The psychological contract that nobody signs
 Time for strategy built on the foundational economy
 Why being ‘work-ready’ matters more than ever
 The North's future doesn't end at Manchester
 Exit or legacy? Why every owner needs a plan
 Who speaks up for SMEs when giants get bigger?
 The true value of HR in an AI-driven working world